Numbers Tell the Story
Use math and history to discover how data reveals the impact of Medgar Evers' legacy.
Use math and history to discover how data reveals the impact of Medgar Evers' legacy.
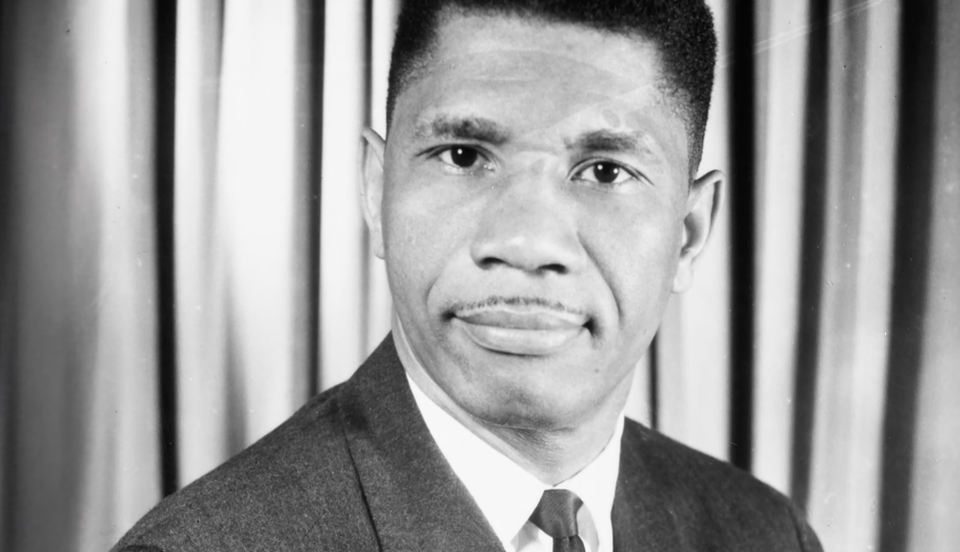
This interdisciplinary third-grade lesson combines mathematics and history to help students understand how numbers, timelines, and data can tell meaningful stories about change. Using clips from Everlasting: The Life and Legacy of Medgar Evers, students explore how mathematical concepts such as elapsed time, graphs, and data analysis can deepen their understanding of the Civil Rights Movement and the lasting impact of Medgar Evers' work.
Through hands-on activities, students create timelines, analyze voter registration data, and use evidence to explain how measurable change occurred over time. By connecting math skills with real historical events, students discover that numbers can help tell the story of progress while recognizing the people behind the data.
Cherish Montgomery
Students begin by watching a documentary clip highlighting Medgar Evers' efforts to desegregate Jackson public schools and discuss the compelling question: How can numbers and data help us understand how the world changes over time? This introduction encourages students to see mathematics as a tool for understanding history.
Students investigate important events from Medgar Evers' life by building timelines, calculating elapsed time, creating scaled bar graphs from historical voter registration data, and analyzing how numbers can illustrate progress during the Civil Rights Movement.
Students use their completed timelines and graphs to construct an evidence-based explanation of how data demonstrates real-world change. The lesson concludes by examining both the strengths and limitations of data and creating a class display that honors Medgar Evers' legacy through numbers and personal reflection.
Students place key events from Medgar Evers' life on a timeline and calculate the elapsed time between important moments in history.
Using historical voter registration data, students create scaled bar graphs and analyze how numbers reflect change over time.
Students combine evidence from their timelines and graphs to explain how Medgar Evers' work created measurable change in Mississippi.
Students investigate how data served as evidence during the Civil Rights Movement and create a collaborative "Change Over Time" display that pairs meaningful statistics with reflections on Medgar Evers' lasting impact.